Monitoring the performance of your AWS ECS (Elastic Container Service) cluster is crucial to ensure your application operates efficiently, especially under varying workloads. While AWS CloudWatch provides robust tools for tracking metrics, you can enhance your observability by integrating it with other APM tools like Dynatrace for more advanced dashboards, alerting, and root-cause analysis.
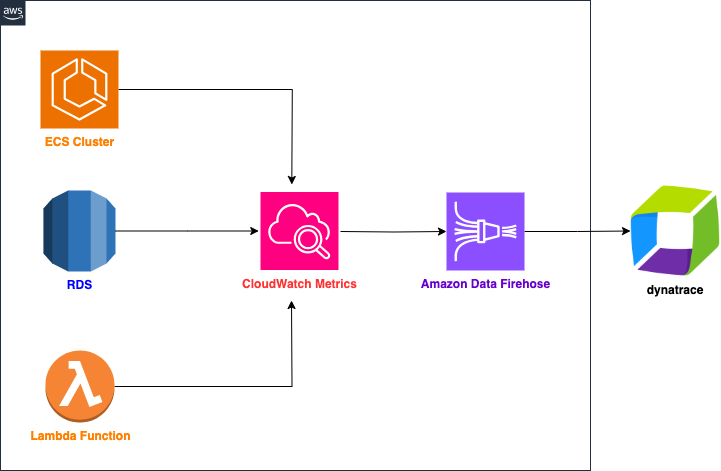
This blog will guide you through streaming AWS CloudWatch metrics to Dynatrace using Amazon Data Firehose and CloudWatch Metric Streams. We’ll also cover how to create Dashboard and Service-level Objective (SLO) in Dynatrace to monitor ECS cluster performance.
1. Overview of Streaming CloudWatch Data to Dynatrace
AWS CloudWatch offers basic monitoring, but when combined with Dynatrace, you gain advanced observability features like real-time dashboards, historical data trends, and proactive alerting. This integration allows you to:
- Monitor CPU and memory utilization of ECS tasks in real time.
- Ingest detailed logs from ECS tasks for deeper analysis.
- Set up custom dashboard and SLO in Dynatrace to track ECS cluster health.
We’ll use:
- Amazon Data Firehose to deliver streaming data directly to Dynatrace.
- CloudWatch Metric Streams to send metrics to the Data Firehose.
2. Prerequisites
Before setting up the streaming pipeline, ensure the following:
- Dynatrace Account: Either you have an active Dynatrace environment or sign up for a free trial account here.
- CloudWatch Logs and Metrics: AWS service (e.g. ECS cluster) that is sending logs and metrics to CloudWatch.
- IAM Permissions: Your AWS user or role should have appropriate permissions for CloudWatch and Kinesis.
- Dynatrace Access Token: Required to authenticate and send data from AWS to Dynatrace.
- Dynatrace environment URL: E.g. https://<your_environment_ID>.live.dynatrace.com
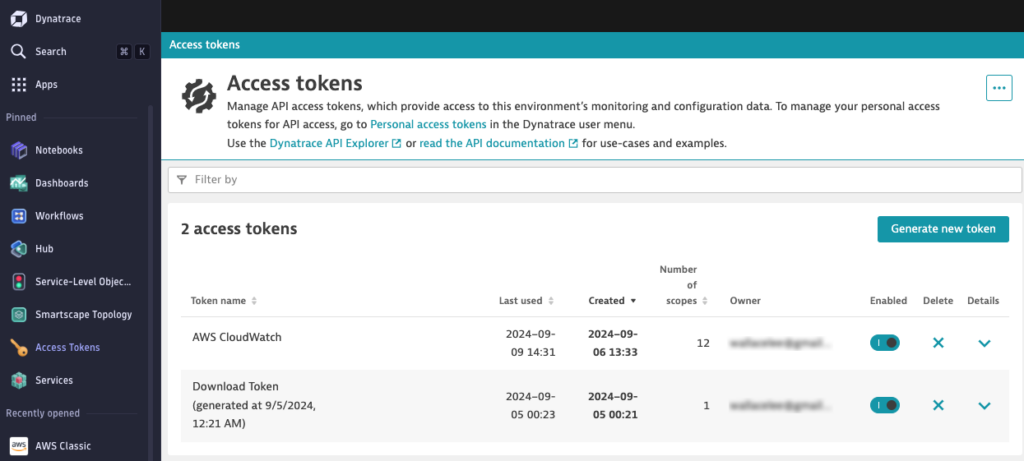
3. Generating a Dynatrace Access Token
The Dynatrace Access Token is essential for authenticating your integration with the Dynatrace API, allowing logs and metrics to be sent from AWS to Dynatrace.
Step-by-Step: Generating a Dynatrace Access Token
- Log into Dynatrace:
- Open your Dynatrace environment and log in with your credentials.
- Navigate to API Token Settings:
- In the Dynatrace UI, click on the Settings gear icon located at the bottom left of the navigation pane.
- From the settings menu, navigate to Integration > Dynatrace API.
- Create a New Access Token:
- Click on the Generate Token button to create a new Access Token.
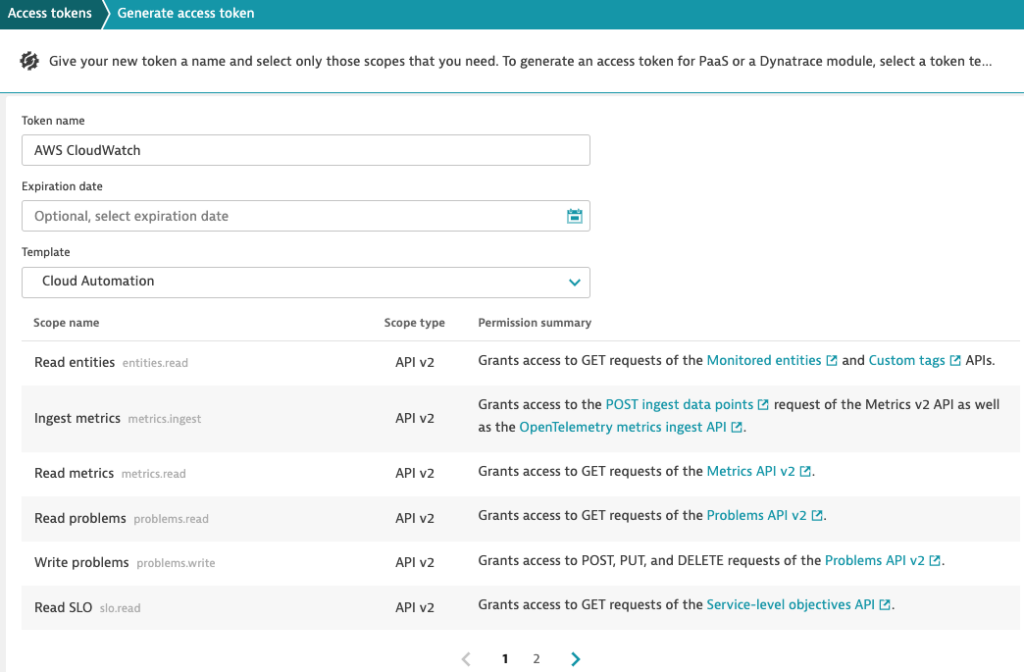
- Assign Permissions to the Token:
- Assign the required permissions to the token based on your use case. To stream CloudWatch Logs and Metrics, ensure you select the following permissions:
- Read Metrics
- Ingest Metrics
- Assign the required permissions to the token based on your use case. To stream CloudWatch Logs and Metrics, ensure you select the following permissions:
- Save and Copy the Token:
- After generating the token, save it in a secure place. You’ll need it for CloudWatch Metric Stream configuration.
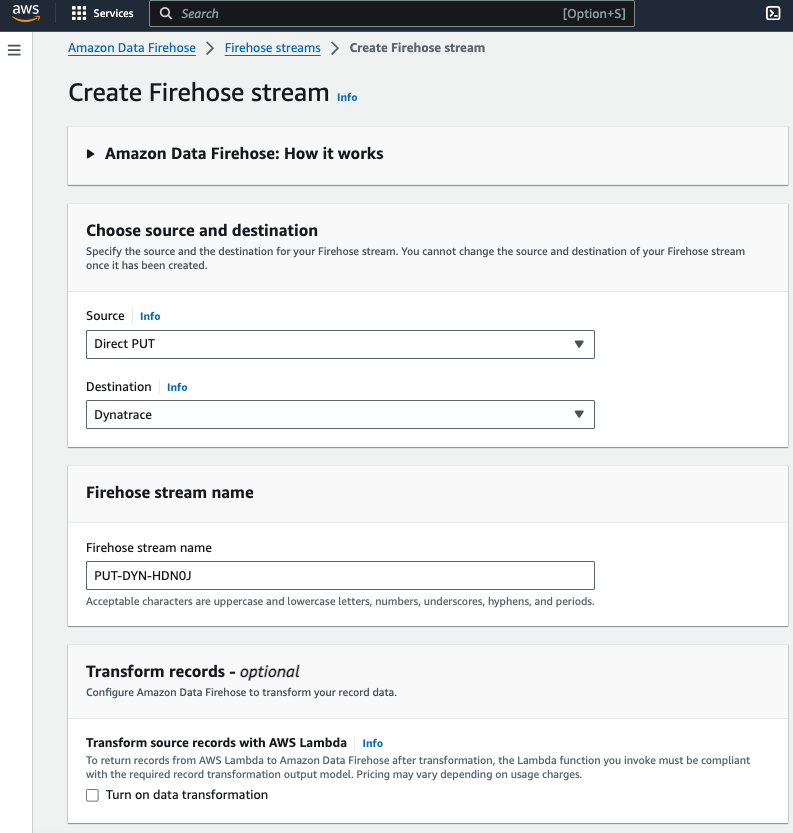
4. Create Amazon Data Firehose Stream
Step 1: Set Up Amazon Data Firehose
- Create a Data Firehose Stream:
- In the AWS Console, navigate to Amazon Data Firehose and click on Create Firehose Stream.
- Set the source as Direct PUT to allow CloudWatch Logs to push data into the stream.
- Choose Dynatrace as the Destination since you’ll be streaming logs to Dynatrace.
- Name the stream:
- Enter a name for the Firehose stream
- Transform records:
- Make sure data transformation is disabled
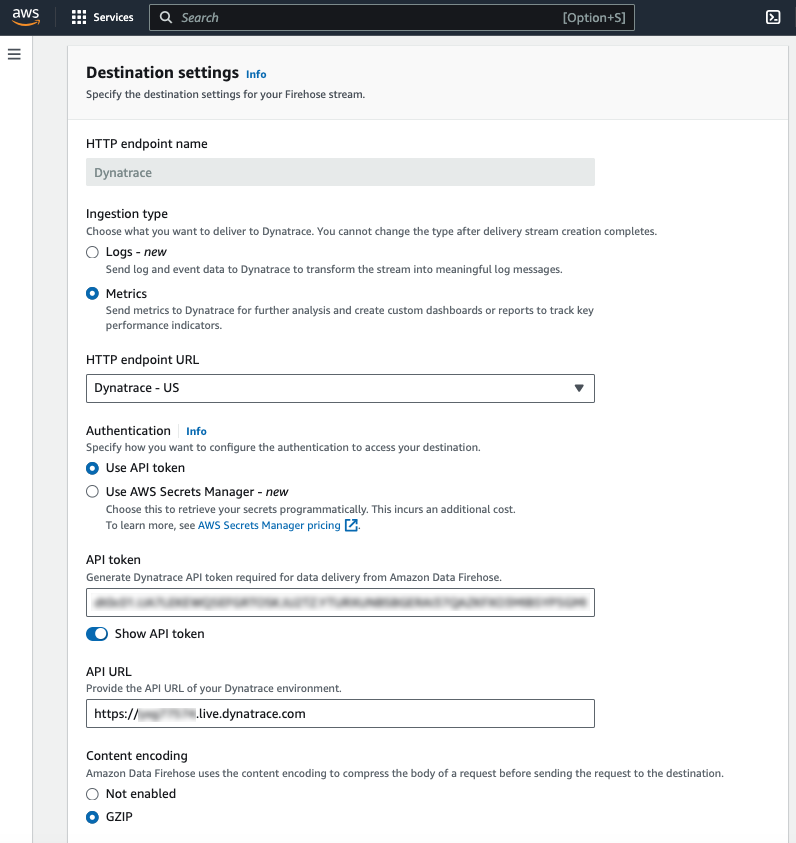
- Configure the Destination settings:
- In Ingestion type, select Metrics and choose Dynatrace – US as the HTTP endpoint URL
- In Authentication, select Use API token and enter your Dynatrace Access Token
- In API URL, enter your Dynatrace environment URL (e.g.
https://<your-dynatrace-environment-id>.live.dynatrace.com) - In Content encoding, select GZIP to reduce data transfer size
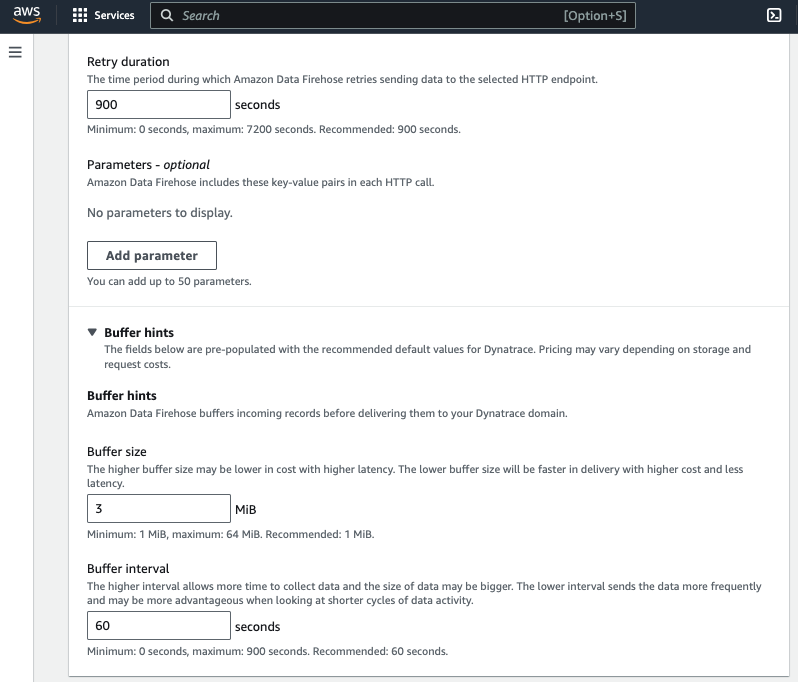
- In Retry duration, enter 900
- In Buffer hints, set an appropriate Buffer size and Buffer interval depending on your expected log volume. A buffer size of 3MiB and an interval of 60 seconds is a good starting point
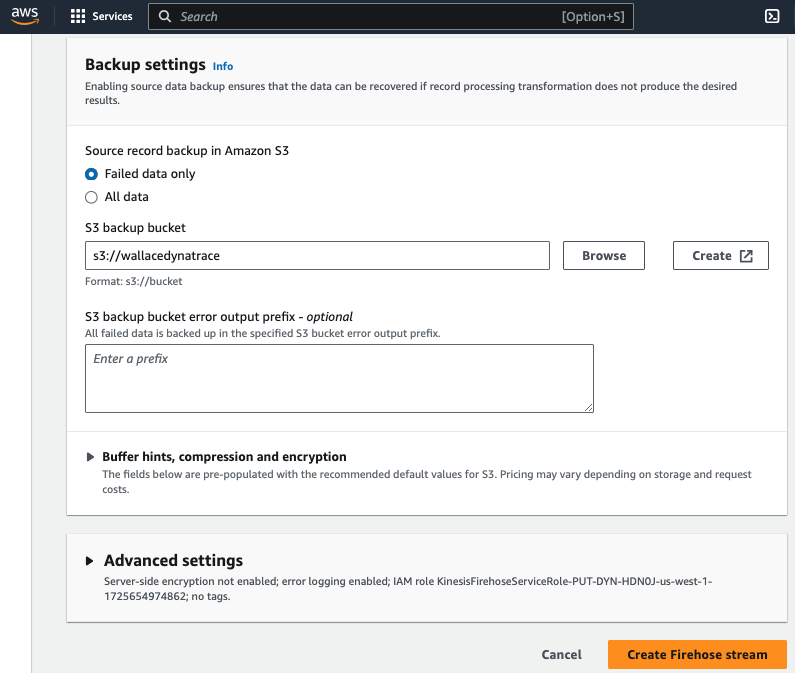
- Set Backup Settings:
- In Backup mode, select Failed data only
- In S3 backup bucket, either create a new S3 bucket or use an existing one as the backup
- Create the Delivery Stream:
- Review your configuration and click on Create Firehose Stream.
5. Create CloudWatch Metric Stream
CloudWatch Metric Streams allows you to continually stream CloudWatch metrics to a Data Firehose delivery stream that delivers your metrics to where you want them to go. You can stream them to a data lake such as Amazon S3, or to any destination or endpoint supported by Firehose including third-party providers. JSON, OpenTelemetry 0.7, and OpenTelemetry 1.0 formats are supported natively, or you can configure transformations in your Firehose delivery stream to convert the data to a different format such as Parquet.
Step 1: Set Up CloudWatch Metric Stream
- Open the CloudWatch Console:
- Navigate to CloudWatch > Metrics > Streams.
- Select Create Metric Stream
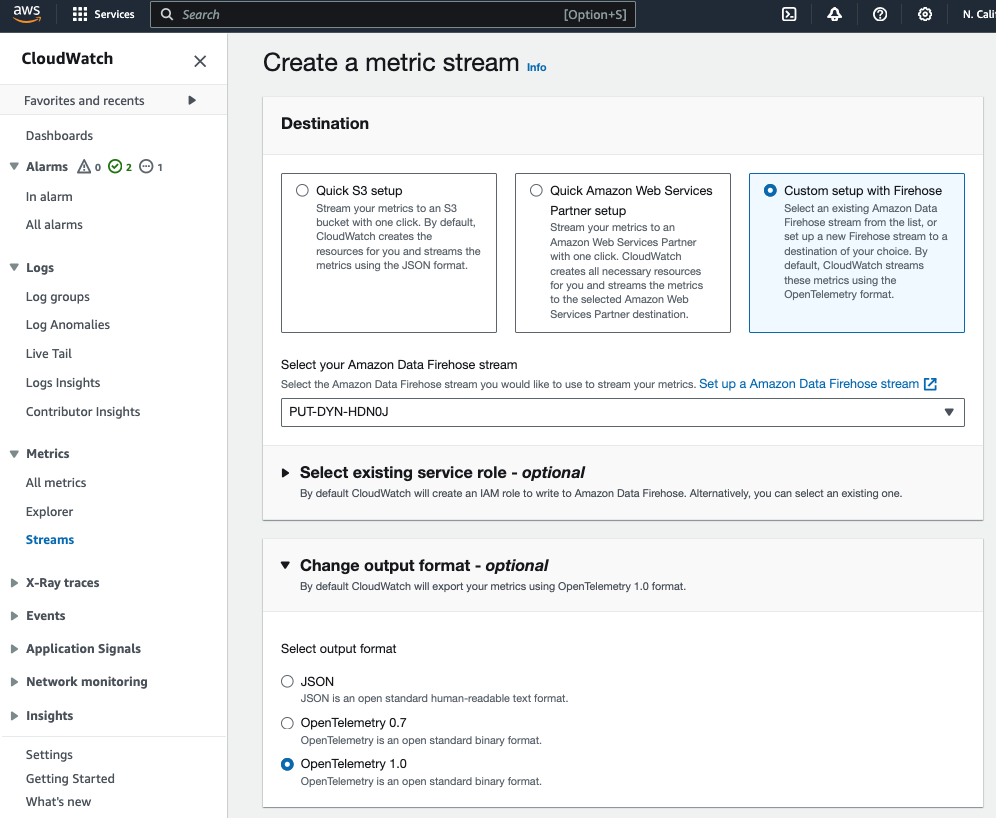
- Destination:
- Choose Custom setup with Firehose as the destination for the metric stream.
- Select the Data Firehose stream you created earlier.
- Change Output Format:
- Select OpenTelemetry 1.0 as the format for the metrics. Dynatrace supports OpenTelemetry, making this the best format for the data stream.
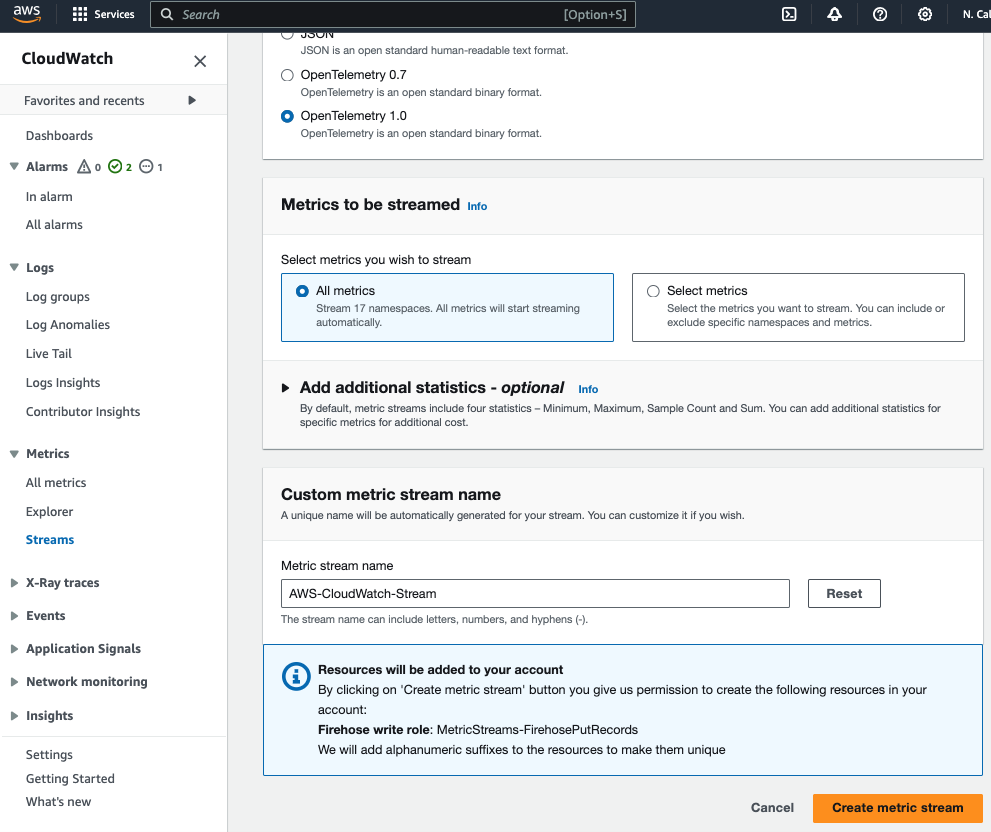
- Metrics to be Streamed:
- Choose All metrics if you want to stream all metrics from namespaces automatically
- Choose Select metrics if you want to include or exclude specific namespaces and metrics
- Custom Metric Stream Name:
- Enter a name for your metric stream
- Select Create metric stream and CloudWatch will start streaming metrics to Dynatrace through the Firehose.
Step 2: Enable AWS Stream in Dynatrace
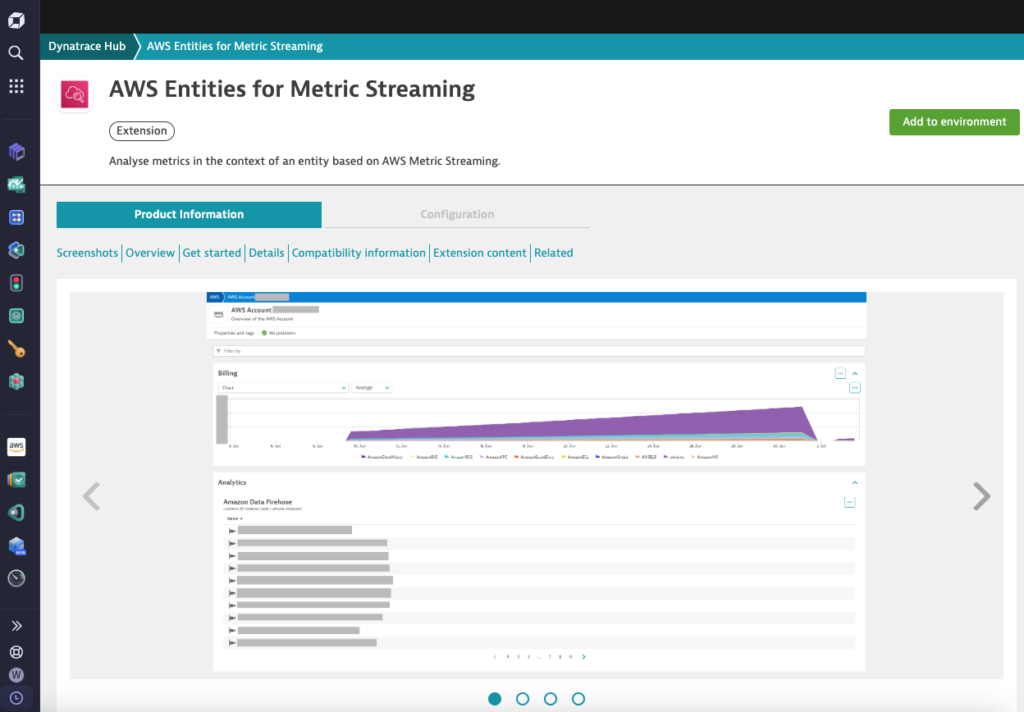
In order to ingest CloudWatch metrics into Dynatrace, you need to install the AWS Entities for Metric Streaming extension.
- Go to Dynatrace Hub:
- In Dynatrace, go to Search and enter Hub.
- Select Add to environment
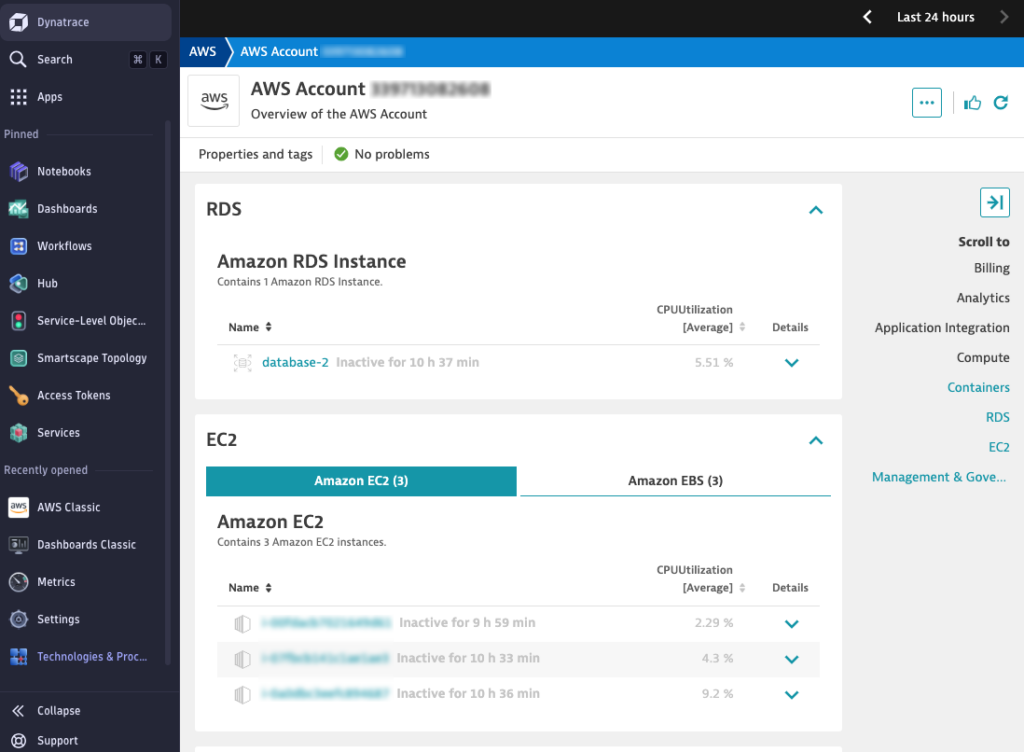
Step 3: Verify Metrics in Dynatrace
- Log into Dynatrace:
- In Dynatrace, go to AWS Classic > Go to AWS Metric Streams and select your AWS Account
- Verify Metric Ingestion:
- After a few minutes, you should see metrics for your AWS services (like EC2, Containers, RDS, etc.) available.
6. Create SLOs for ECS Performance in Dynatrace
Step 1: Define Your SLOs
Once you have CloudWatch metrics streaming into Dynatrace, you can set up dashboards and create SLO (Service-level Objective) to monitor your AWS service. SLOs are performance targets you aim to achieve over a specific period. For ECS performance, a typical SLO could be:
- CPU Utilization SLO: ECS tasks’ CPU utilization should stay below 80% for 99.9% of the time.
- Memory Utilization SLO: ECS tasks’ memory utilization should stay below 70% for 99.9% of the time.
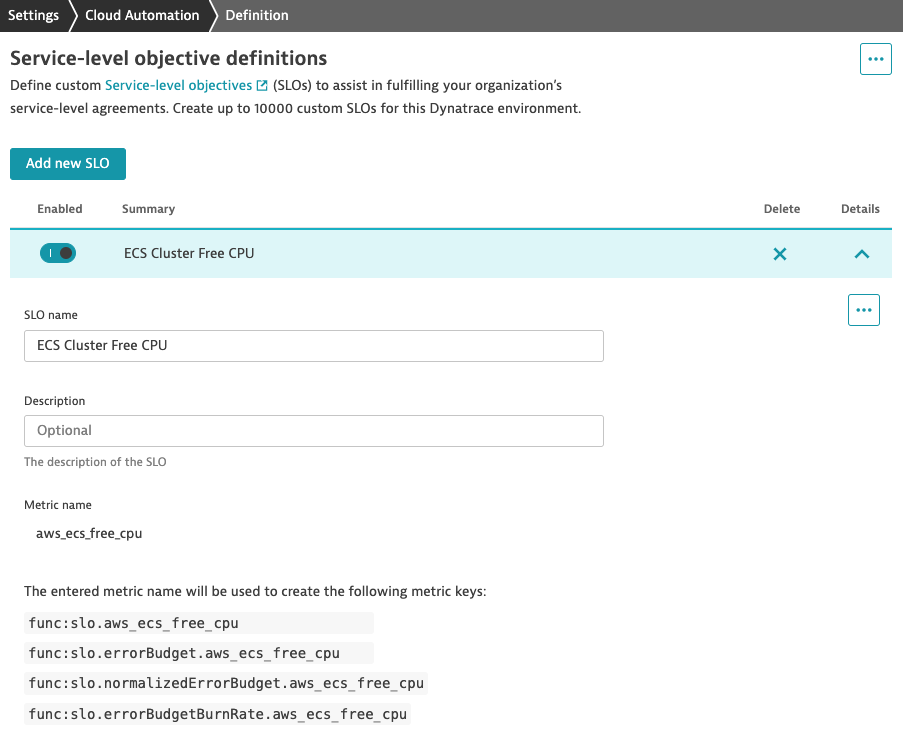
Step 2: Create SLOs in Dynatrace
- Navigate to SLO Settings:
- In Dynatrace, go to Service-level objectives (SLOs).
- Create a New SLO:
- Click on Add new SLO and provide a descriptive name (e.g., “ECS CPU Utilization SLO”).
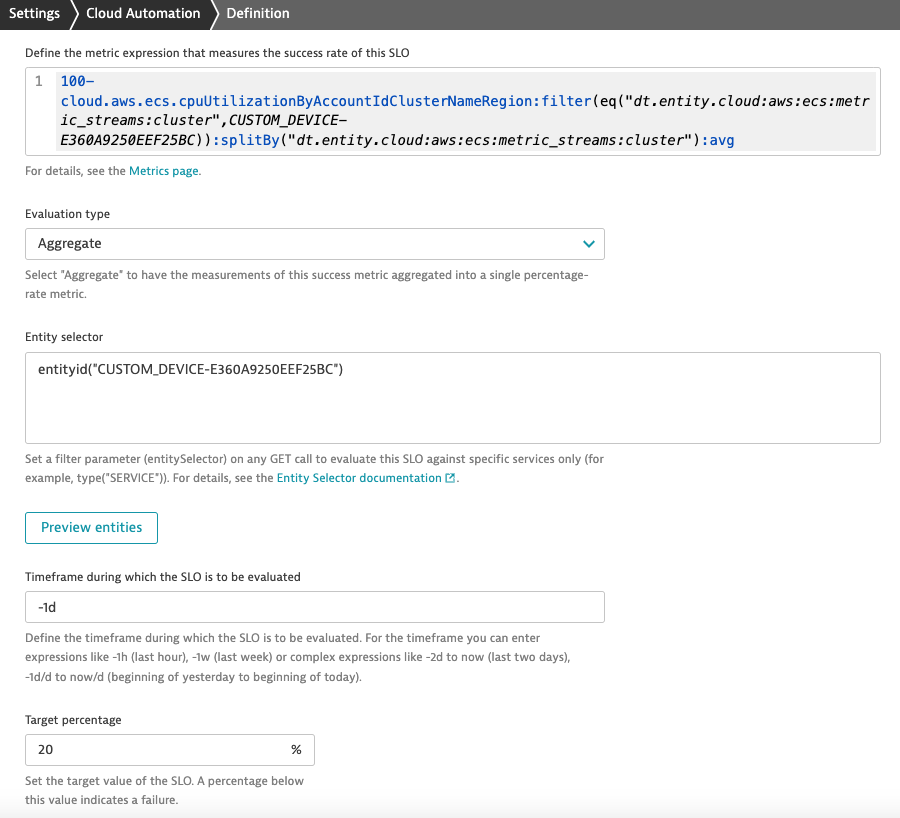
- Define the metric expression that measure the success rate of this SLO:
- Enter the following expression to measure the available CPU Utilization of ECS cluster
- Replace CUSTOM_DEVICE-E360A9250EEF25BC with actual id obtained from AWS Metrics Stream for your ECS cluster or other AWS service to be monitored
100-cloud.aws.ecs.cpuUtilizationByAccountIdClusterNameRegion:filter(
eq("dt.entity.cloud:aws:ecs:metric_streams:cluster",
CUSTOM_DEVICE-E360A9250EEF25BC)):splitBy(
"dt.entity.cloud:aws:ecs:metric_streams:cluster"):avg- Evaluation type:
- Choose Aggregate
- Entity selector:
- Input entityid(“CUSTOM_DEVICE-E360A9250EEF25BC“) and replace “ECSCUSTOM_DEVICE-E360A9250EEF25BC” with actual id obtained from AWS Metrics Streams
- Timeframe during which the SLO is to be evaluated:
- Input -1d to evaluate the SLO for the last 24 hours
- Target percentage:
- Set the SLO target to 20% compliance (i.e., available CPU capacity should stay above 20% for 99.9% of the time).
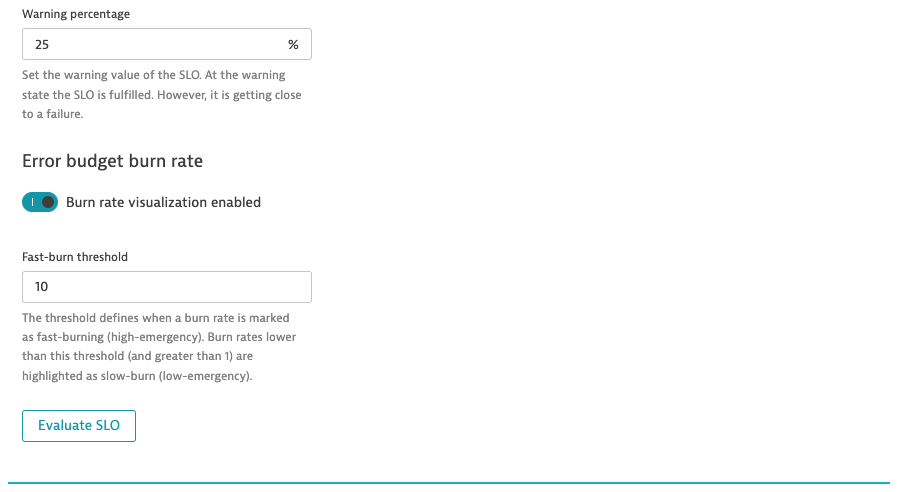
- Warning percentage:
- Set the warning to 25%.
- Review and Save:
- Review your SLO configurations and save them. These SLOs will now be tracked over time, allowing you to evaluate how well your ECS cluster meets the defined objectives.
Step 3: Monitor and Analyze SLOs
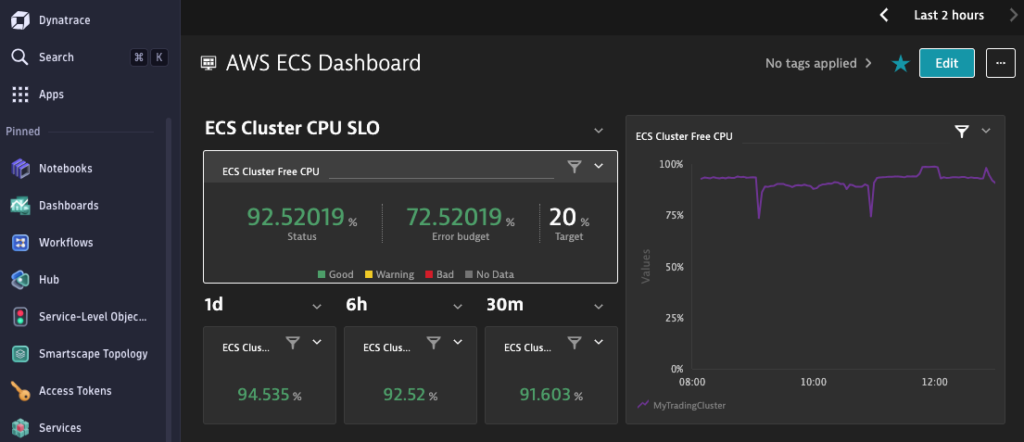
- Visualize SLOs in Dashboards:
- Go to the Dashboards section in Dynatrace and create widgets that display the compliance rate of your CPU and memory SLOs over time.
- Analyze Breaches:
- If your SLOs are not being met, investigate which ECS services are breaching the thresholds and what actions can be taken to improve performance.
7. Conclusion
By following the steps outlined in this blog, you can set up a robust monitoring system that streams AWS CloudWatch Logs and Metrics into Dynatrace using Amazon Data Firehose and CloudWatch Metric Streams. More importantly, instead of relying solely on alerts, you can define and track Service Level Objectives (SLOs), providing a clear, long-term view of how well your ECS cluster is performing in relation to the defined performance and reliability targets.
Thank you for reading my blog and I hope you like it!