Introduction
I wrote this article to turn my own notes into something useful, for me and for anyone who is trying to stand up a real, no-nonsense dashboard. I wanted one place to see if my blog is up, how fast it feels, where visitors come from, and whether anyone’s rattling the doors. So I choose Grafana as the tool, wired Alloy to ship logs into Loki and built something that I can actually use day to day.
Why Grafana Cloud (and how it compares)
There’s no shortage of options:
- Dynatrace – full-platform observability and automation with powerful topology, causation AI, and managed SLOs; great for enterprise scale and “it just works” workflows.
- Datadog / New Relic – polished, hosted APM + logs + synthetics; excellent UX; cost typically grows with event volume.
- Elastic Cloud (ELK) – strong log analytics; dashboards are flexible, PromQL-style workflows are less native.
- AWS CloudWatch – native and cost-friendly in AWS, fewer visualization niceties.
- Self-hosted OSS – Prometheus + Grafana + Loki/Tempo = control & low cost, but you own the plumbing.
Why I chose Grafana Cloud here: I wanted a lightweight, OSS-friendly pipeline (PromQL/LogQL), easy hosted endpoints, built-in synthetics, and fast iteration for a personal site. I still reach for Dynatrace at work for end-to-end service topology, automation, and AI-assisted triage—but for this blog, Grafana Cloud + Loki + Alloy is the sweet spot.
What makes a good dashboard?
- Purpose: one screen answers “Is it up?”, “Is it healthy?”, “Where are users from?”, “Any attacks?”
- Actionable: panels link to Explore pre-filtered for quick deep dives.
- Clarity: consistent units and thresholds; don’t make readers translate.
- Few, great panels (not too much scrolling). Add short descriptions so on-call knows how to react.
Architecture
- WordPress/Apache: my blog runs on a Linux box that writes standard access/error logs.
- Alloy on the host: a tiny agent tails those logs, adds useful fields (status, path, IP → country), and ships them out.
- Grafana Cloud Loki: receives the logs over HTTPS (scoped token), so I can search and chart them with LogQL.
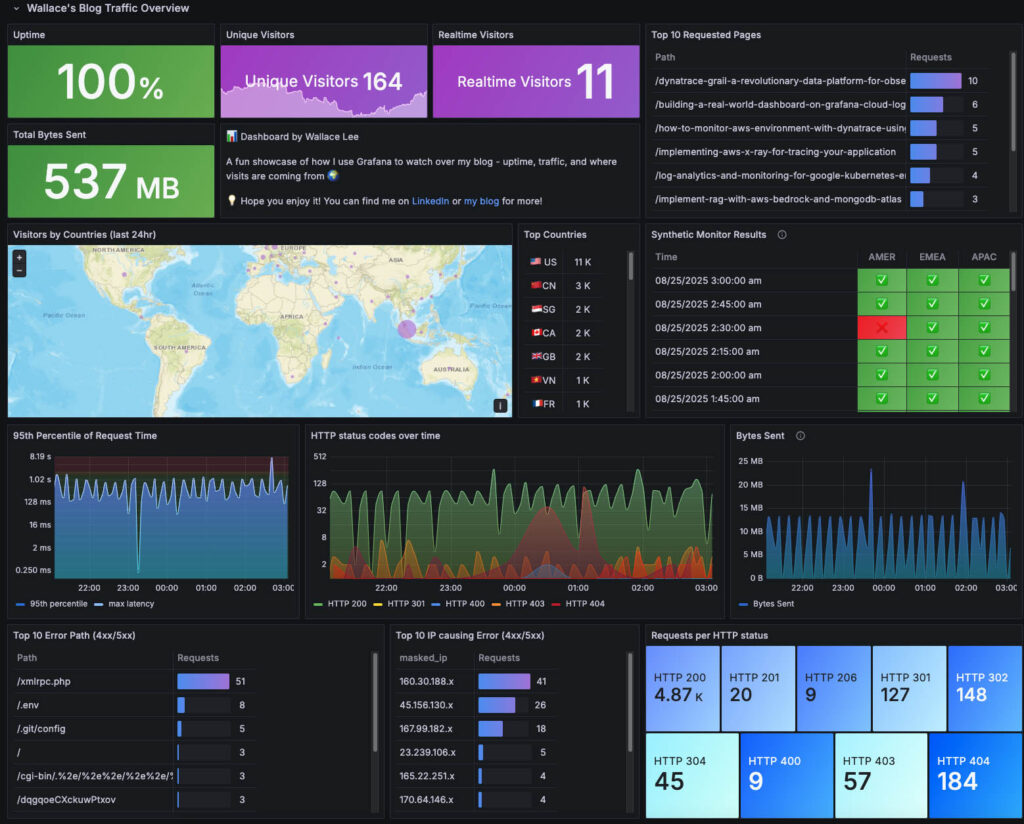
- Dashboards in Grafana: panels for status codes, p95/max latency, top pages/countries, bytes, and “suspicious activity.”
- Synthetic Monitoring: browser checks from distinct geo-locations at regular intervals to verify real-world reachability.
Flow: Apache on Linux → Alloy (parse + GeoIP) → Grafana Cloud Logs → Grafana dashboard
1) Set up Grafana Cloud Logs (Managed Loki)
Grafana Cloud Logs is a fully managed Loki service, a log aggregation system powered by Grafana—an open-source, Prometheus-inspired tool optimized for efficiency and scalability in log management. Unlike traditional log systems that index full-text content, Loki indexes only metadata (labels) for each log stream – such as service names, environments, or Kubernetes metadata. This minimalist approach keeps indexing lean and cost-effective.
To setup Loki in Grafana Cloud:
- In your Grafana Cloud stack, go to Administration → Users and access → Cloud access policies.
Create a cloud access policy with scopelogs:write. - Create an access-policy token and add it to the newly created policy
- To get the endpoint for pushing logs to Loki, go to Loki → Details / Send logs:
- URL:
https://<cluster>/loki/api/v1/push - User (the basic_auth username)
- Password (your access-policy token)
- URL:
2) Install Grafana Alloy
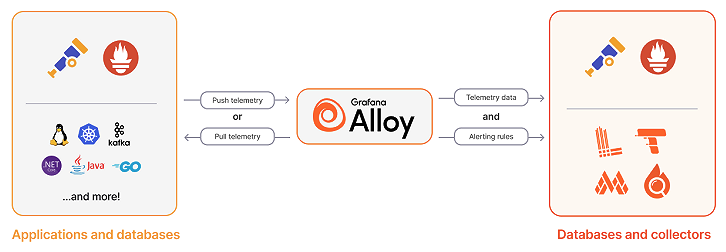
Grafana Alloy is Grafana’s open-source distribution of the OpenTelemetry Collector, enhanced with built-in support for Prometheus pipelines. It unifies collection, processing, and export of logs, metrics, traces, and profiles—all through a single agent.
If you’ve worked with observability tools like Dynatrace OneAgent, you’ll notice the contrast: OneAgent is almost zero-touch, automatically discovering workloads and wiring telemetry with little to no configuration. Alloy, by comparison, gives you flexibility and openness, but you do need to roll up your sleeves to manage its pipelines and config.
To install Alloy, from Grafana Cloud → Connections → Collector → Install Grafana Alloy, generate the install command for your distro/arch. Disable Remote Configuration so you can manage a local config.alloy.
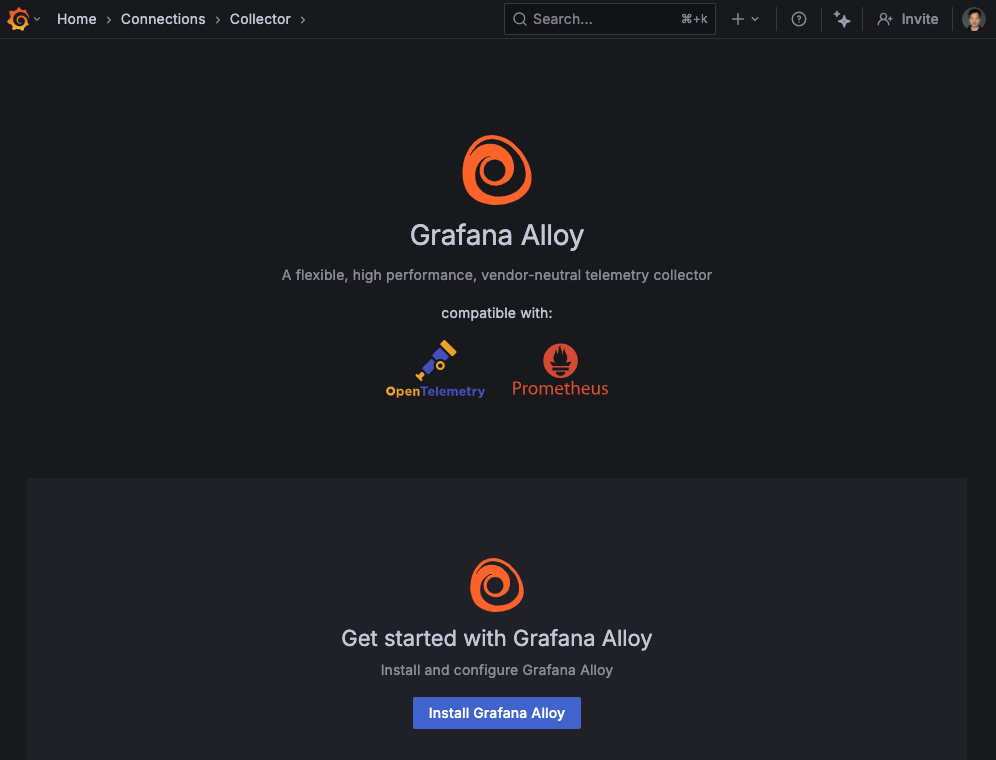
Copy and Run the generated alloy install command on your host, then start Alloy (example):
nohup sudo ./alloy-linux-amd64 run ./config.alloy > alloy.log 2>&1 &3) Configure Alloy: ship and enrich Apache logs to Loki
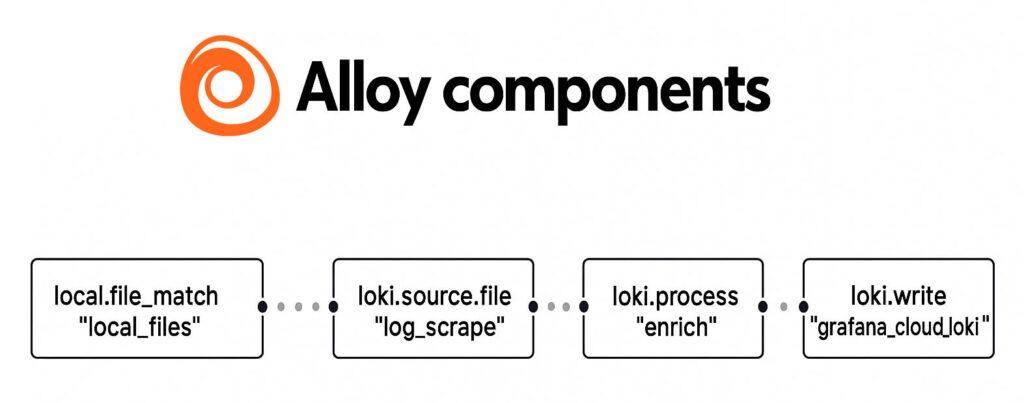
There are 4 major components to configure Alloy to ship logs to Loki:
local.file_matchdiscovers files on the local filesystem using glob patternsloki.source.filereads log entries from files and forwards them to otherloki.processloki.processenrich the log lines (e.g. parsing, adding context, mapping ip address to their originated countries, etc.) and forwards the results toloki.writeloki.writesends the log lines to the Loki endpoint over the network using the Lokilogprotoformat
config.alloy (redacted, minimal example)
// 1) Which files to watch
local.file_match "local_files" {
  path_targets = [
    { "__path__" = "/opt/xxx/apache/logs/access_log", job = "apache_access" },
    { "__path__" = "/opt/xxx/apache/logs/error_log",  job = "apache_error" },
  ]
  sync_period = "5s"
}

// 2) where to read logs from
loki.source.file "log_scrape" {
    targets    = local.file_match.local_files.targets
    forward_to = [loki.process.enrich.receiver]
    tail_from_end = true
}

// 3) Parse and enrich access logs
loki.process "enrich" {
  stage.match {
    selector = "{job=\"apache_access\"}"

    stage.regex {
      expression = "^(?P<ip>\\S+) \\S+ \\S+ \\[(?P<time>[^\\]]+)\\] \\\"(?P<method>\\S+) (?P<path>[^ ]+) (?P<proto>[^\\\"]+)\\\" (?P<status>\\d{3}) (?P<bytes_sent>\\d+|-)"
    }

    stage.timestamp {
      source = "time"
      format = "02/Jan/2006:15:04:05 -0700"
    }

    // Enable Geoip using GeoLite Country Database
    stage.geoip {
      source  = "ip"
      db      = "/usr/share/GeoIP/GeoLite2-Country.mmdb"
      db_type = "country"
    }

    stage.labels {
      values = {
        ip                 = "",
        method             = "",
        status             = "",
        path               = "",
        bytes_sent         = "",
        geoip_country_code = "",
      }
    }
  }

  forward_to = [loki.write.grafana_cloud_loki.receiver]
}

// 4) Push to Grafana Cloud Loki
loki.write "grafana_cloud_loki" {
  endpoint {
    url = "https://<your-loki-cluster>/loki/api/v1/push"
    basic_auth {
      username = "<LOKI_INSTANCE_ID>"
      password = "<ACCESS_POLICY_TOKEN>"
    }
  }
}
4) Enable GeoIP for the geomap
Apache logs only know visitor IPs. To draw a world map and a “Top countries” table, I need a country code on each log line. Country-level GeoIP is a sweet spot: it’s useful for trends and anomaly spotting (e.g., sudden traffic from a new region) without getting too granular or privacy-heavy.
I use the free MaxMind GeoLite2-Country database. Country (not city) keeps label cardinality low and avoids PII while still powering the Geomap and country panels.
- Create a free MaxMind account and download GeoLite2-Country (
.mmdb). - Place the file on the server, e.g.
/usr/share/GeoIP/GeoLite2-Country.mmdb. - (Optional) sanity check:
mmdblookup --file /usr/share/GeoIP/GeoLite2-Country.mmdb --ip <some_ip> country iso_code - In the above Alloy config, enable the
stage.geoipstep so each access log line gets ageoip_country_codelabel.
5) Dashboard Panels
Below are the panels I have added to my dashboard, what each is for, how to read it during an incident, and the query I used.
a) Website Uptime (Stat) + Synthetic Monitoring
To watch real user reachability—not just server CPU—I stood up three Synthetic Monitoring browser checks in Grafana across AMER, EMAC, and APAC regions. Each check probes my website every 15 minutes.
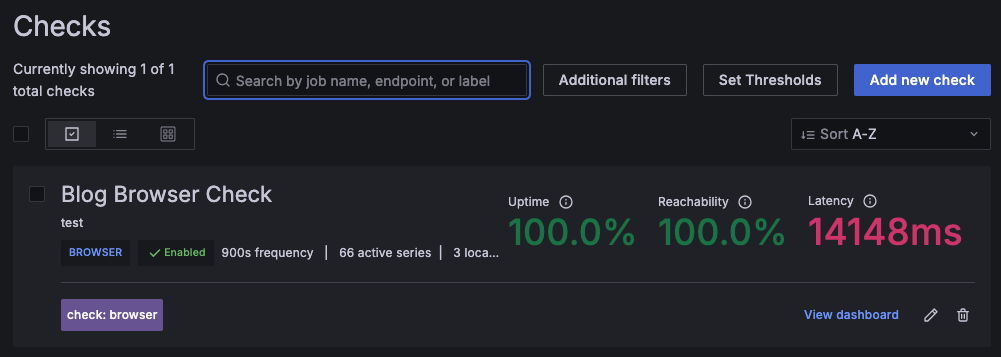
Why this matters:
- If all three fail together, I likely broke the site or origin.
- If one region fails while the others pass, it’s routing, DNS, CDN, or a regional outage.
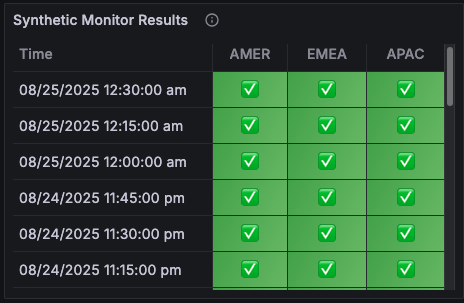
- I add a table showing how many checks succeeded per probe in the last window.
How I read it:
The table shows each probe’s recent success (green light) or fail (red light).
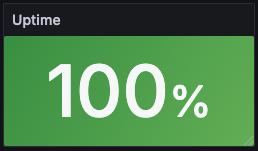
An Uptime panel showing the current status in the last 15 minutes base on all three probes’ results:
Query for this panel:
max by () (max_over_time(probe_success{job="Blog Browser Check", instance="test", probe=~"Calgary|London|Singapore"}[900s]))b) Unique Visitors & Realtime Visitors (Stat)
These two tiles tell two stories:
- Range uniques: “How many distinct visitors over the current dashboard window?”
- Real-time uniques: “Who’s on the site in the last 5 minutes?”
Why it’s here: perfect for campaign days and sanity checks during incidents.
How I read it: if range uniques look normal but real-time drops to near zero, it’s likely an availability or routing issue right now.
Panel tips: The 5-minute tile uses a Relative time override so it always reflects “right now,” no matter what the main range is.

The queries for the above tiles are:
//Unique Visitors
count(sum by (ip) (count_over_time({job="apache_access"}[$__range])))

//Realtime Visitors
count(sum by (ip) (count_over_time({job="apache_access"}[5m])))
c) Top Requested Pages (Table)
What do people actually read on my blog? This table shows the top 10 requested pages, with a small gauge to show relative weight.
Why it’s here: helps prioritize performance work and content decisions.
How I read it: While I’m curious how popular my pages are, I’m also looking for unusual new paths jumping into the top 10. And I exclude static assets and noisy bot paths so this stays actionable. I also keep the path column as plain text so gauges only color the count, not the URL.
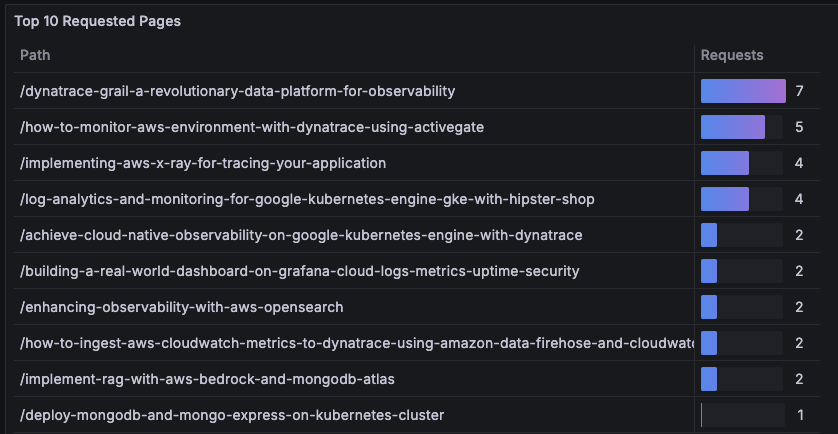
The query for the above table:
topk(
  10,
  sum by (path) (
    count_over_time(
      {job="apache_access",
       status="200",
       path!="/",
       path!~".*\\.(ico|svg|css|png|jpg|jpeg|webp|avif|js|xml|txt|woff2|ttf)(\\?.*)?$"}
      [$__range]
    )
  )
)
d) Visitors by Countries (Geomap)
I use a world map to spot where traffic is coming from at a glance. Bigger bubbles mean more hits; if a new country suddenly lights up, that’s a clue -maybe a campaign landed, or a bot net woke up.
Why it’s here: quick reality check on audience reach and anomalies by region.
How I read it: I keep this locked to last 24 hours so it doesn’t swing wildly. If one country balloons, I click it to drill into just those logs.
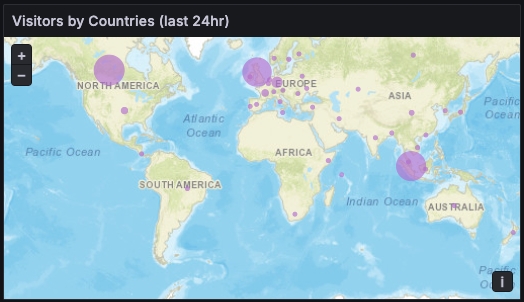
Since I already enriched the log lines with geocode, showing the bubble on the map can be easily done by adding a Markers layer to the Geomap with the Lookup mode on geoip_country_code.
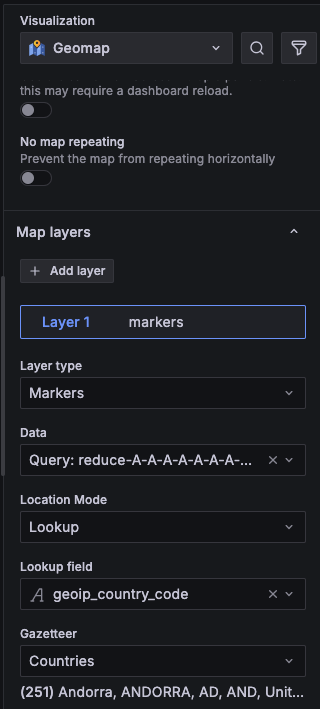
The query I use is:
sum by (geoip_country_code) (
  count_over_time({job="apache_access", geoip_country_code!=""} | __error__=`` [24h])
)
e) Top 10 Countries (Table)
This is the map’s sidekick. Same story, but with numbers you can quote.
Why it’s here: to answer “Which countries topped the list this period?” without eyeballing bubbles.
How I read it: sorted descending; if a country jumps from #7 to #2, I open Explore on that country code and look for a pattern (referrer spike, bot user-agents, etc.). I also use Value mappings to show cute flag labels (🇨🇦CA, 🇸🇬SG) so it’s readable at a glance.
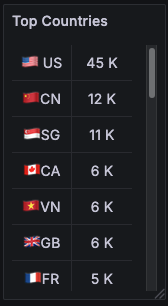
f) Performance: p95 & max request time (Time series)
Two lines; two jobs. p95 is what most users feel. Max catches outliers and ugly spikes.
Why it’s here: when p95 creeps up, I check the top pages; when max spikes, I look for a single heavy request or backend hiccup.
How I read it: I set soft thresholds (e.g., 1 sec warning, 1 sec critical) to color the background. I keep p95 in a solid blue shade and max in a lighter blue light so it’s obvious which is which.
The queries for the performance tile are:
//p95 percentile performance
max by (host) (quantile_over_time(
  0.95,
  {job="apache_access"}
  | regexp " (?P<request_time>\\d+)$"
  | unwrap request_time
  [$__interval]
) / 1000)

//max latency
max by (host) (max_over_time(
  {job="apache_access"}
  | regexp " (?P<request_time>\\d+)$"
  | unwrap request_time
  [$__interval]
) / 1000)
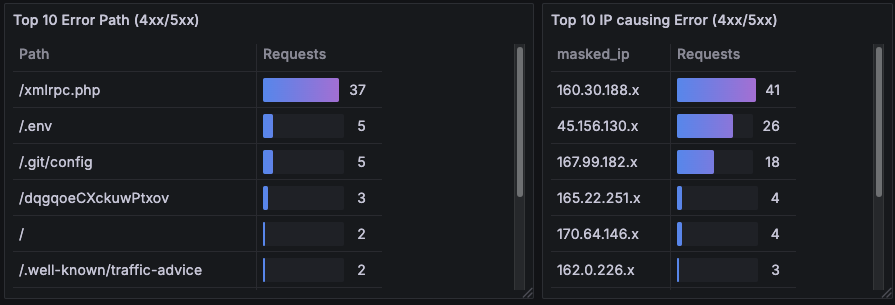
g) Security watch: Error paths & Noisy IPs
A pair of short lists to surface probing and scanning behavior:
- Top error paths (4xx/5xx)
- Top IPs causing errors
Why it’s here: early warning for things like /xmlrpc.php, /.env, or /.git/config hits—classic probing.
How I read it: if a single IP dominates, I open Explore on that IP for status codes and user agents, then decide whether to block or rate-limit upstream.
Final Thoughts
In the end, this project was about turning raw Apache logs into a living, trustworthy picture of my site. Grafana Cloud gave me the hosted plumbing; Alloy and Loki kept it OSS-friendly; and a handful of well-chosen panels (status codes, p95/max, countries, bytes, synthetics, and security) turned noise into signal. The result is a dashboard I actually use: it tells me if I’m up, who I’m serving, how it feels, and whether anyone’s poking the wrong doors. Next steps for me are light alerts on error rate and p95, and maybe a small RUM script to capture real client timing. If this write-up helps you ship your first version faster, even better—steal the ideas, adapt them to your stack, and make the dashboard yours.

You can find a snapshot of my dashboard here

